Why are bonds important?
The importance of bonds has clearly increased compared to before.
Global rises in long-term interest rates, bond buybacks for yield suppression as seen with Bessent, and coordinated US-Japan intervention. These are even influencing the policy decision-making of the Fed and central banks of various countries, which should theoretically be uncontrollable. Come to think of it, there is also the fact that the Bank of Japan had been suppressing long-term interest rates through YCC (Yield Curve Control) until just two years ago.
The impact is also significant at the national level. Often, when interest rates rise, the burden of lending to individuals and companies (especially small and medium-sized enterprises) increases more than the rise in deposit interest rates. Especially now, in a phase where both short-term and long-term interest rates are moving, I believe this is the greatest concern for mortgage holders and households considering future home purchases.
In any case, considering the public’s attention and the influence on other asset classes, the need to pay attention to trends in the bond market has increased whether we like it or not. That is why I consider bonds to be the ‘gravity of the market’.
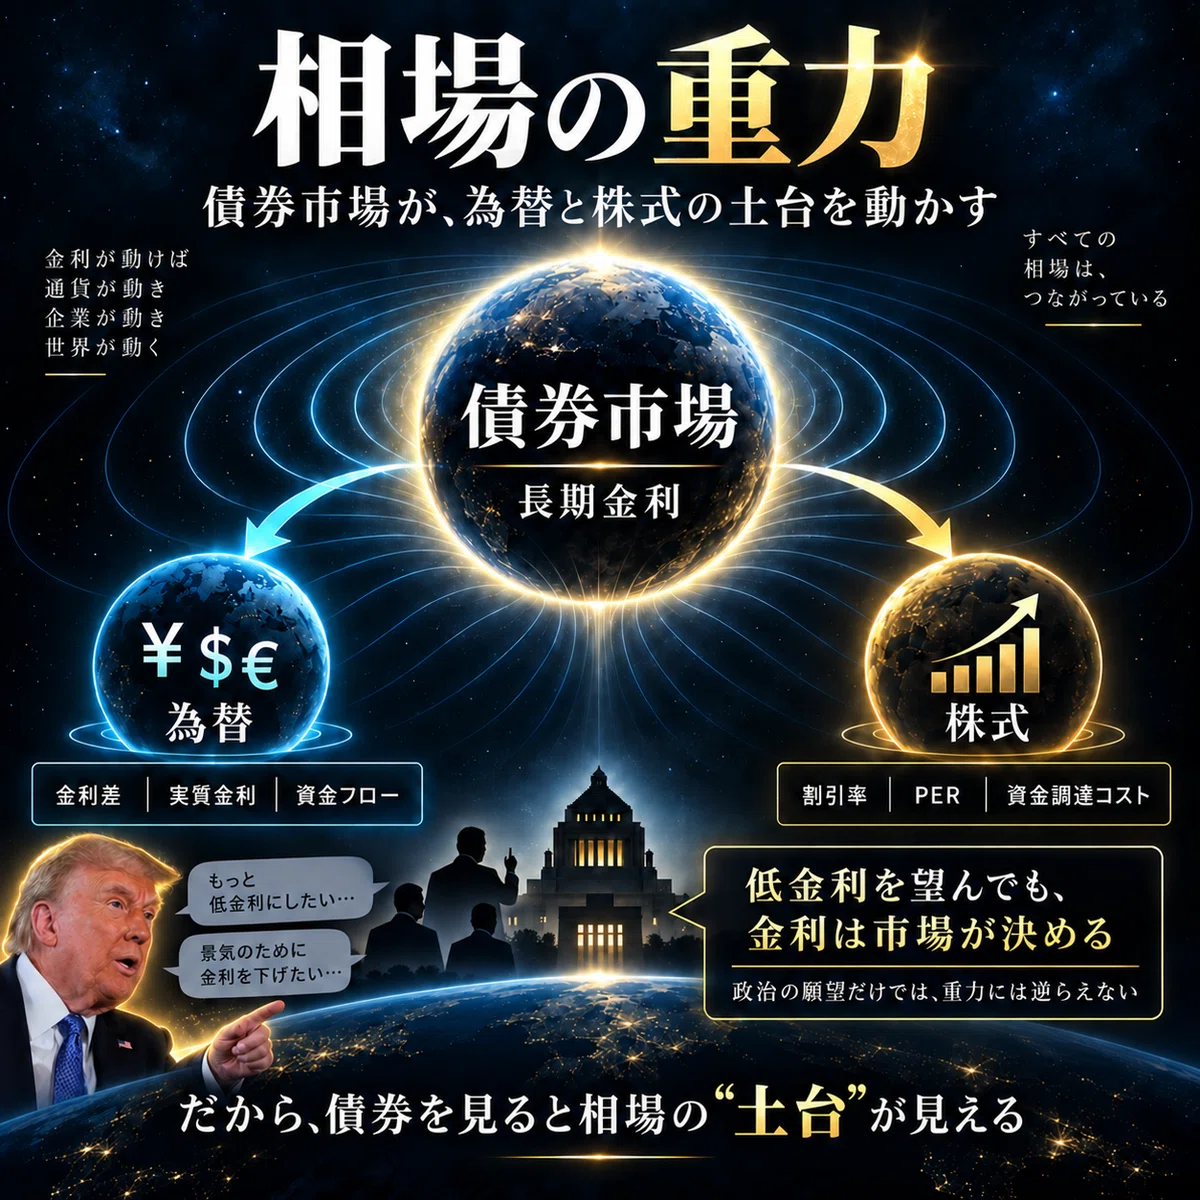
Interest rate movements around the FOMC
Here, I would like to focus on US long-term interest rates, which have the most influence among bonds, and analyze in this article, in my own way, what those movements are caused by.
What I am focusing on is the decline in yields immediately after the FOMC. Why did they fall? For now, the analysis materials are generally ready, so I will proceed with the factor analysis in order. Even at the time of this writing, I do not know what the factors are, so I would like to structure the article while proceeding with the analysis.
State of short-term and long-term interest rates around the FOMC
The Fed decided on a 25bps rate hike, raising the policy interest rate to 3.75-4.00%. However, looking at the bond market after that, while short-term interest rates rose, long-term interest rates actually fell.
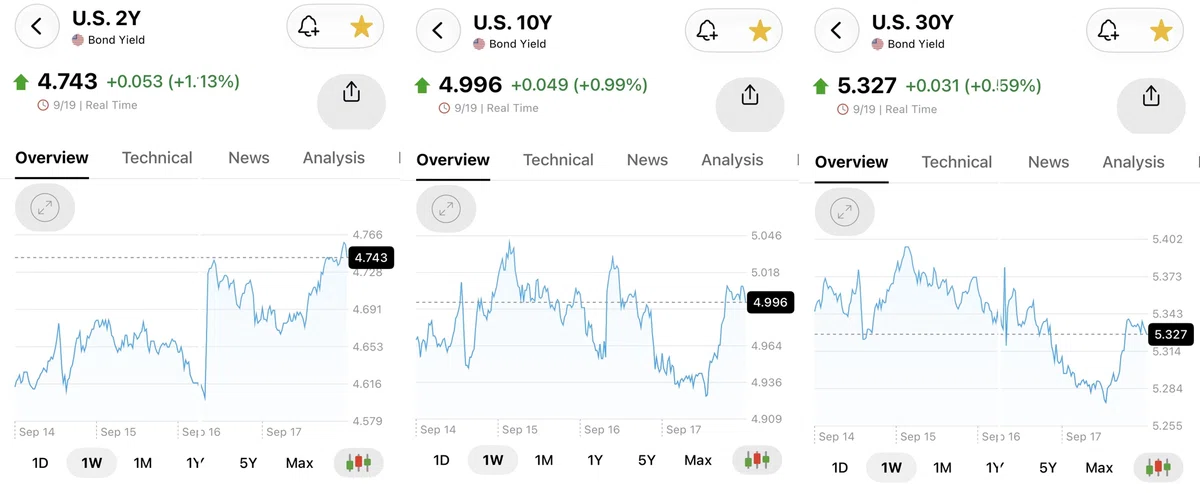
Source: Investing.com
Looking at the period around the 9/16 FOMC, the 2-year rate jumped from around 4.60% to the 4.7% range at once and has maintained a high level since then. This is a movement that quite clearly ‘priced in the Fed’s additional rate hikes and policy interest rate path to the upside.’
On the other hand, the 10-year rate jumped to around 5.02% immediately after the FOMC, but then fell to the 4.93% range. However, it has recently (as of 9/19) returned to around 5.00%. The 30-year rate also swung upward for a moment before falling to around 5.28% and has now returned to about 5.33%.
Why did yields fall immediately after the FOMC?
If you look for news, you will find any number of explanations. Fed rate hikes, inflation, fiscal deficits, government bond supply and demand, AI investment, geopolitics, growth expectations… The explanations differ slightly depending on the expert.
So this time, I will put other opinions aside for a moment and analyze the actual market using the ‘tools for looking at long-term interest rates’ that I have used in previous articles.
You can’t tell anything just by the fact that interest rates fell
It is a fact that the US 10-year rate fell from 5.01% to 4.94%, but this alone does not tell us what happened.
So, I will cut the pizza 🍕 that has appeared several times in previous articles once again.
Nominal 10-year rate ≒ 10-year real interest rate (TIPS) + 10-year BEI
The idea of dividing a single pizza 🍕 called the nominal interest rate into ‘real interest rate’ and ‘expected inflation (BEI)’.
Here, FRED, published by the St. Louis Fed, comes into play.
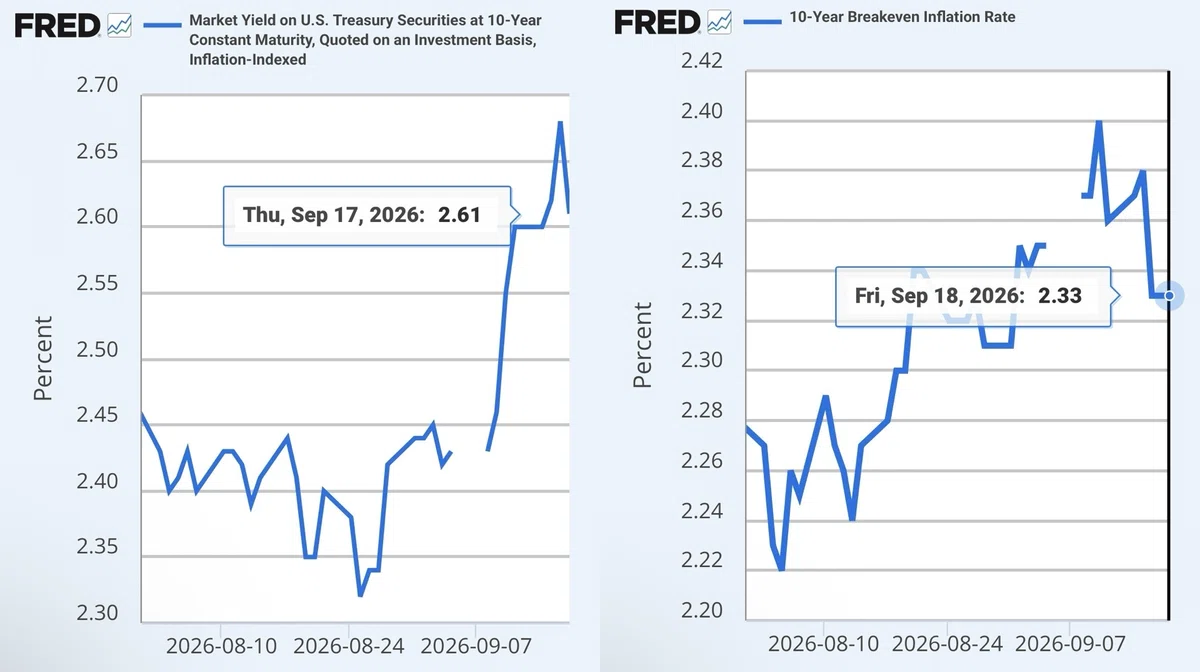
Source: St. Louis Fed
On September 16, the day of the FOMC, the 10-year TIPS real interest rate (left graph) was 2.68%. Since it was 2.44% on September 1, it rose by about 24bps in the process leading up to the FOMC.
Then what about the BEI (right graph)? The 10-year BEI on September 1 was 2.35%. On the 16th, the day of the FOMC, it was 2.33%. It is actually almost flat.
Here, I get my first ‘clue’.
From the beginning of September to the FOMC, the 10-year rate rose significantly, but the BEI hardly rose at all. On the other hand, the TIPS real interest rate rose significantly. In other words,
this rise in long-term interest rates cannot be explained by ‘a rise in inflation expectations’ alone, at least. The center of the price movement seems to be on the real interest rate side.
It is even more interesting to look at the decline after the FOMC. The nominal 10-year yield on September 16 was 5.01%. The following day, the 17th, it was 4.94%. A decrease of 7 bps. Meanwhile, on the FRED screen at hand, the 10-year TIPS real yield also fell from 2.68% to 2.61%, which is also a decrease of 7 bps.
And the 10-year BEI is,
September 16: 2.33%
September 17: 2.33%
and it has not moved at all.
This is quite easy to understand.
The portion of the 10-year yield decline after the FOMC was also almost entirely due to movements on the real yield side.
In other words, it can be said that the real side was the main driver for both the rise before the FOMC and the subsequent decline, and it seems that to understand the 10-year yield this time, it is necessary to consider “why the real yield is moving so much.”
This is what can be understood in broad terms by looking only at FRED.
The fact that “real yields have risen” and its content
Real yields certainly rose from 2.44% to 2.68% just before the FOMC, but all that can be said from this is the fact that “real yields have risen.”
There are many factors that cause real yields to rise. It could be expectations of Fed rate hikes, or it could be expectations of economic growth. It could be massive capital demand due to the AI boom. The market might be thinking that the natural rate of interest has risen. Or perhaps higher real yields are being demanded due to fiscal deterioration and an increase in government bond supply.
An interesting WSJ article
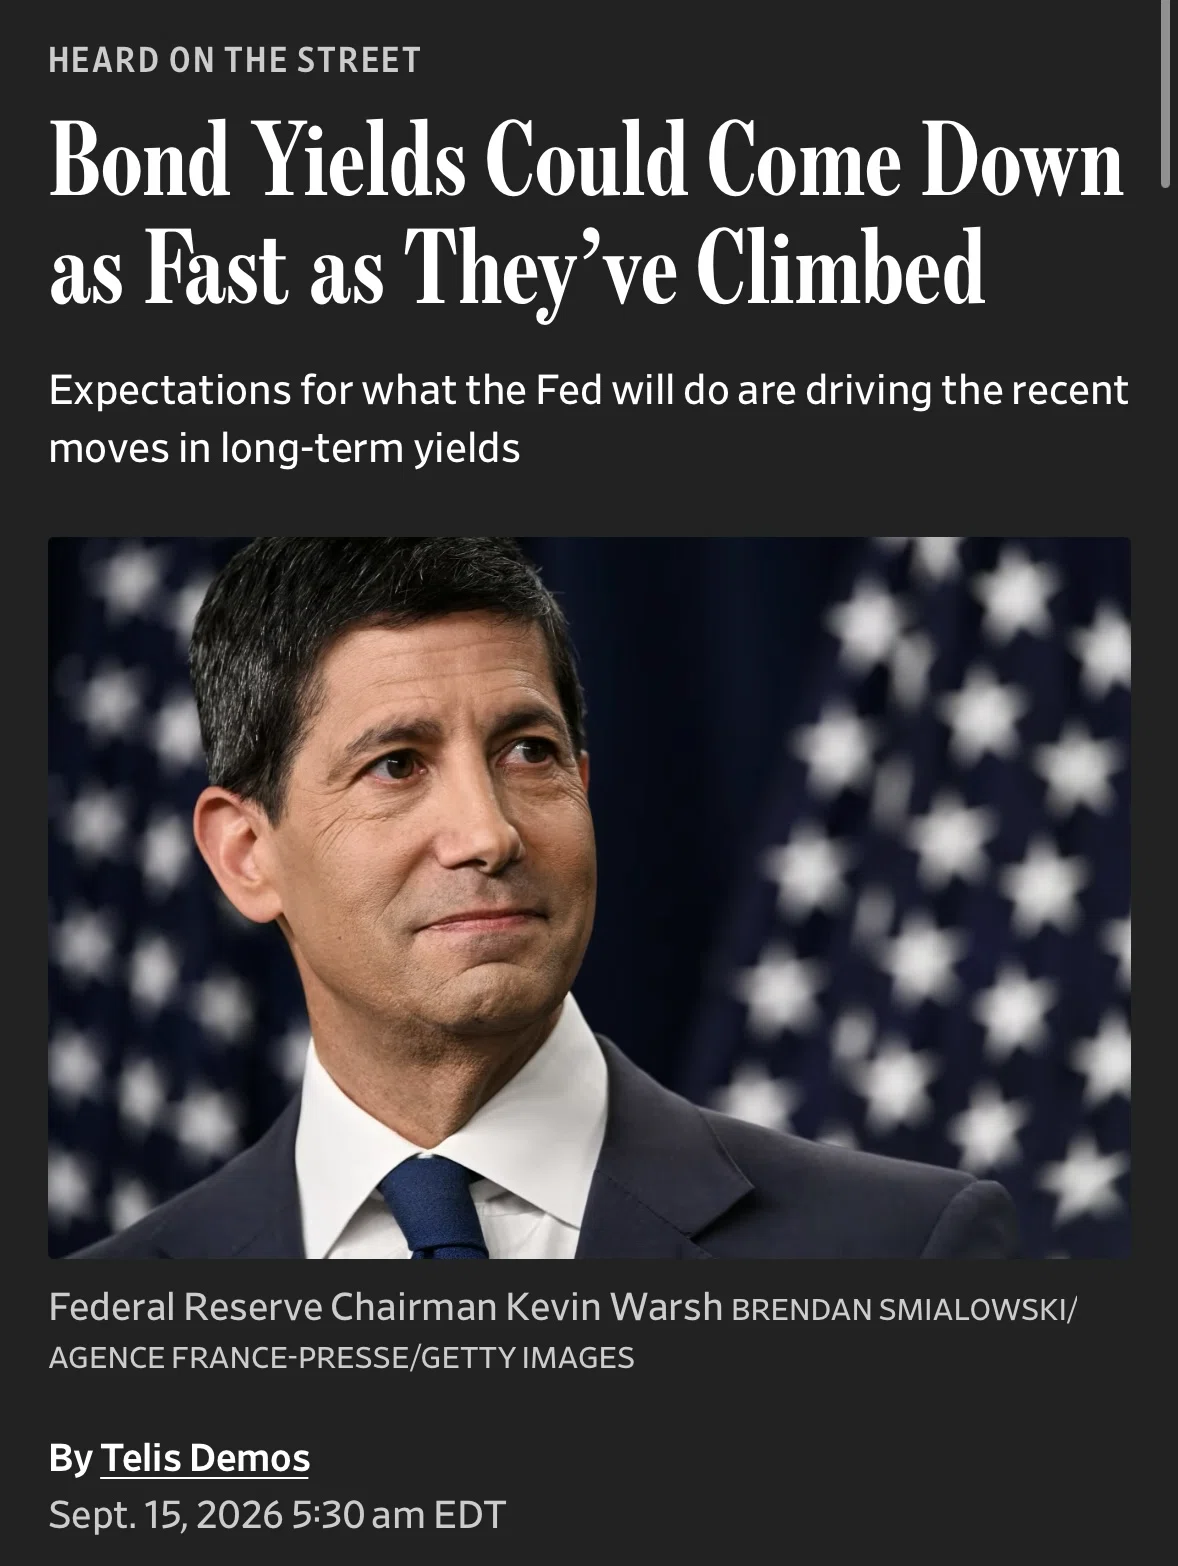
Although it was before the FOMC, a famous column in the WSJ dated September 15, “Heard on the Street“had an article with this title:
“Bond Yields Could Come Down as Fast as They’ve Climbed” At the beginning of this article, it says,
“Sometimes, the simplest explanation for something works.”
So what is that “simple explanation”?
The WSJ does not see fiscal anxiety or a surge in inflation expectations as the main drivers of the recent rise in US long-term interest rates, but rather views the market’s upward revision of future short-term interest rates as the major factor. It analyzes that while long-term inflation expectations are generally stable and recent term premiums have not risen significantly, the outlook for future short-term interest rates is rising.
Another perspective on long-term interest rate analysis
This time, the WSJ introduces an analysis of nominal interest rates from a different angle using the San Francisco Fed’s model. It is broken down as follows:
10-year yield ≒
Average expected short-term interest rate over the next 10 years + Term premium
On the bank’s website, it is also explained as a model that decomposes nominal interest rates into “future short-term interest rate expectations” and “term premiums for the risk of holding long-term bonds.”
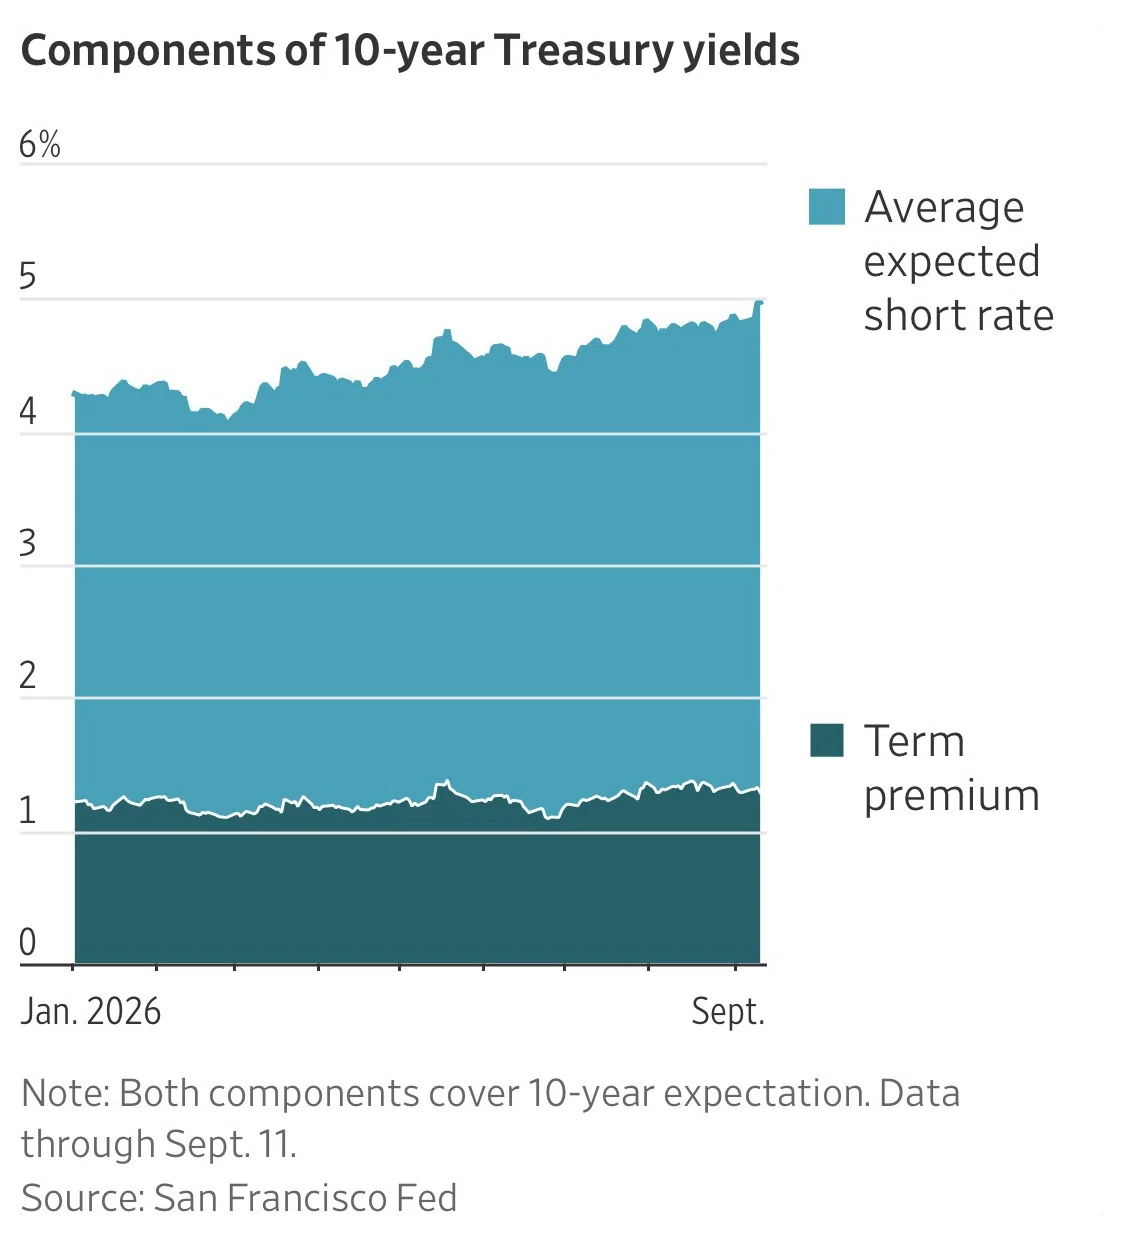
(Source: SF Fed/WSJ article)
What is the average expected short-term interest rate?
The “average expected short-term interest rate” that appeared in this article is, simply put, what percentage the market thinks the average will be if it continues to operate at an interest rate close to the policy rate for the next 10 years.
If the market thinks,
“The Fed is not done after one hike”
“The policy rate will go much higher”
“And the high state will last for a long time”
then this average expected short-term interest rate will rise.
On the other hand, the term premium is an add-on that says, “If I’m going to hold long-term bonds for 10 years, give me extra for that risk.”
What is superior about the average expected short-term interest rate?
Looking at the initial nominal analysis, we can see that “the current rise in long-term interest rates is happening on the real side.” However, as mentioned above, there are many factors that push up real interest rates.
That is where the perspective of dividing long-term interest rates into “average expected short-term interest rate” and “term premium” becomes useful.
In the graph, if the average expected short-term interest rate is rising, the possibility that the market has revised its future short-term interest rate path upward increases. If the term premium is rising, we consider the possibility that the risk compensation for holding long-term bonds has increased. In other words, the average expected short-term interest rate can be said to be a tool to dig one step deeper from the “perspective of the policy rate path” in order to know “where the real interest rate moved.”
Conclusion of the analysis
First, when I checked the San Francisco Fed’s data after the WSJ article, the movement as of 9/17, immediately after the FOMC, was as follows.
Average expected short-term interest rate: -3 bps
Term premium: -5 bps
→ Total 10-year yield: -8 bps
The first thing that can be said is that since the FRED BEI has hardly moved, it is difficult to attribute this decline in long-term interest rates to “inflation expectations having fallen.”
In short, while inflation expectations have hardly changed, the fact that future short-term interest rate expectations have fallen suggests that the market may have concluded that the Fed will not maintain such high interest rates in the future. Although the term premium has also declined, it is safe to say that at least regarding Fed rate hikes, the outlook for future Fed interest rates has decreased.
So why do Fed rate hike expectations influence yields in both directions, pushing them up and pulling them down?
Central bank rate hikes are factors for both the rise and fall of long-term interest rates
First, the article lists the following factors regarding how current long-term interest rates could fall.
* Middle East situation eases → lower oil prices → reduced Fed rate hike pressure
* Continued Fed rate hikes (market reassurance that “this is enough”)
* AI investment slowdown → reduced corporate bond issuance + growth deceleration
* Economic recession → sharp drop in long-term interest rates
What is interesting here is that Fed rate hikes can act as a factor that pushes long-term interest rates up and down at the same time. What does this mean?
In other words, in the initial process where expectations for rate hikes strengthen, the suspicion that “the market is falling behind the curve” pushes long-term interest rates up.
However, if the Fed carries out the necessary rate hikes and reassures the market that it is not “behind the curve on inflation,” it will then push long-term interest rates down.
This is a relationship seen in the policies and long-term interest rates of any country, so assuming that “rate hikes = rising long-term interest rates” is a taboo.
The possibility of falling as quickly as it rose
As the title of the article suggests, the WSJ points out that the current rise in long-term interest rates is not caused solely by “structural and sticky factors” like fiscal deterioration. If a significant portion of it can be explained by the market upwardly revising the Fed’s policy rate path, then the view is that the reversal will be fast when that premise changes.
In other words, if the cause of the rise is not “structure” but “re-evaluation of expectations,” then the reversal when expectations change will also be fast.
Surprisingly, the point of the WSJ article is that yields might fall rapidly for such “simple reasons.”
Expert opinions often include position talk
As I explained before, long-term interest rates are more vague and elusive than stocks or currencies. That is precisely why diverse views exist.
What should be noted is that not only financial experts like economists but also people like Warsh and Bessent speak about factors conveniently within the scope of their own positions.
Warsh stated at the recent FOMC that the rise in long-term interest rates is due to 1) a strong economy and growth, 2) capital demand due to massive capital investment centered on AI, and 3) geopolitical uncertainty. He specifically mentioned that AI hyperscalers and others require large amounts of capital, which is pushing up yields. Kansas City Fed President Schmid has made similar remarks.
However, they cannot bring themselves to say that “our (Fed) rate hike expectations are pushing up yields.” The market would take it as an outrageous message and the market would become volatile.
Summary: When analyzing long-term interest rates
Looking only at the numbers of whether long-term interest rates have “risen” or “fallen” does not tell you the meaning behind them. What I felt again this time is that the order of analysis is important.
1. First, look at market prices. Divide not only nominal interest rates but also real interest rates and BEI to confirm “what moved.”
2. Real interest rates do not indicate the cause. Even if you know that real interest rates have risen, there are many candidates in the background, such as the Fed, growth, natural interest rates, fiscal policy, supply and demand, and AI investment.
3. If you can find another perspective, layer it on as well. Looking at it as “average expected short-term interest rate + term premium” like this time allows you to further sort out whether the future short-term interest rate path moved or the premium for holding long-term bonds moved.
4. Take others’ opinions as a reference. Fed members, strategists, and the media each have their own positions and analytical frameworks. First, look at the data and then think, “Which part is this person looking at to explain it this way?”
5. Do not mix time horizons. The “tide” of fiscal policy and government bond supply, the “wind” of the Fed and growth/inflation, and the “waves” of FOMC and market pricing changes each move long-term interest rates on different time horizons.
And another important point is that you cannot simply say “rate hikes = rising long-term interest rates.” In the middle of strengthening rate hike expectations, the future short-term interest rate path may be revised upward, pushing up long-term interest rates, and if conditions (market views) change, it will turn to a decline instead.
At the very least, if you can analyze with a reasonable scale of your own, you will be able to listen with a stance of taking a step back and thinking that such opinions exist because of their position, without swallowing others’ opinions whole.
(Reference materials)
St. Louis Fed FRED (10-year TIPS)
St. Louis Fed FRED (10-Year BEI)
San Francisco Fed Treasury Yield Premiums
Thank you for reading.🙇♀️